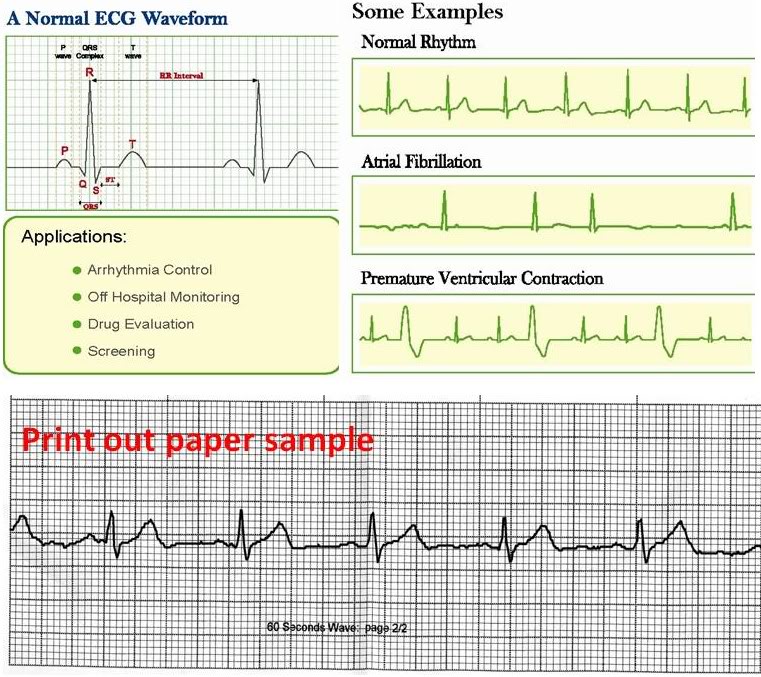
About the ECG Waveform Captured by the ECG Monitor
The ECG waveform depicts the rhythm of your heartbeat during the 30-second measurement and displays the electrical activities that caused the heart to beat. The waveform of each heartbeat shows the progress of the electrical impulses across and through the heart.
1. The first peak indicates the spread of the impulses from and over the atria and signifies the beginning of atrial contraction. This is known as the P wave.
2. The second peak indicates the spread of impulses over the ventricles and the beginning of ventricular contraction. This is known as the QRS complex.
3. The third peak indicates the electrical activity during heart relaxation and is known as the T wave.
More Details from southsudanmedicaljournal
WIKI:
Just more info:
Instruments:
Approximately C $201.83 on ebay


Portable Handheld ECG EKG Heart Rate Heartbeat Monitor MD100B (New Upgraded Software) (including CD and Electrodes) from amazon

Simple DIY ECG + Pulse Oximeter (HOME MADE ECG) By Scott W Harden